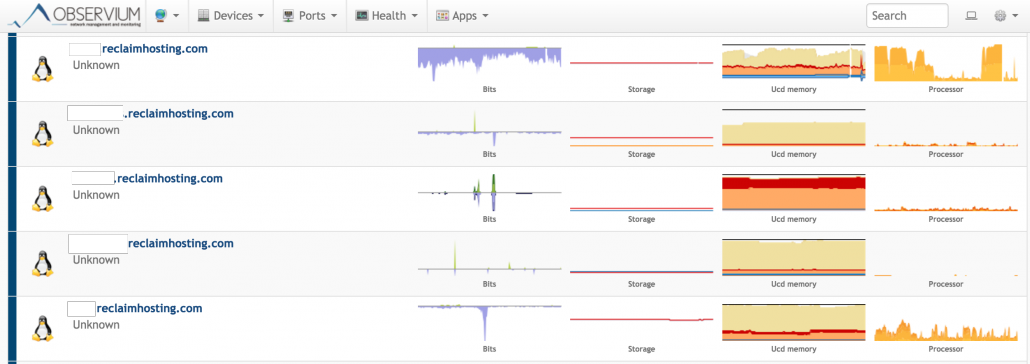
When you’re at a small, growing company, it’s easy to forget about the engine underneath the glitz and glam of all-star support, value-packed hosting services, and the Jim Groom cult of personality. Luckily for us (or for you), at Reclaim, we never forget. Maintaining our infrastructure to be as reliable, scalable, and secure as possible is one of our top priorities, and we recently got set up with the Observium monitoring system to get ahead of any infrastructure issues before they become customer-impacting.
Observium is a low-cost, SNMP-based, extensible, and (reasonably) easy-to-setup platform that helps us by automatically collecting data from our virtual infrastructure and making it digestible and actionable. For example, if we want to get some information about processor usage (a decent benchmark for how hard a system is working) let’s take a look at our processor reporting graph for our BYU server:
The graph shows us some great info we can take action on (or not!). Right now, you can see that the processor utilization is fairly consistent for the past 48 hours, but if I were to zoom out on the graph over time (I can go as far back as I want), we might see the processor usage steadily increasing. At some point, the team will get an automatic alert saying “hey, your processor usage is over a certain amount,” which would signal to us that we might want to upgrade that server to accept more capacity, or dive deeper into what might be causing the increase if it’s not from additional users. Either way, the data is digestible and actionable.
Here’s another, more practical example. This morning, we got a processor utilization alert on one of our shared hosting servers. Large numbers of users did not all just sign up at the same time for new hosting, so Tim thought some suspicious activity might be occurring. Here’s what the Observium graph showed us:
The “spike” at the end is clearly an outlier in comparison to the rest of the time the server is available. Sure enough, Tim looked at our security logs and a suspicious computer was attempting to connect to the server thousands of times. Tim blocked the suspicious IP address and the utilization immediately went back down, as shown in the graph. Again, all of this happened without any impact to the customer’s service – we got the alert and were able to take action before it got so bad that support tickets came in.
In helping us move things along a little quicker and making our alerts more actionable, I integrated the automated alert system with Slack, our collaboration/chat application. Instead of sending emails to a monitoring mailbox or someone’s inbox where they could easily be archived or ignored, the integration exists to alert the entire team at the same time so someone can take action quickly (I mean, that’s kind of the point of an alert, right?) In addition, as a general practice, it is really easy to get into “alert fatigue” in a monitoring system where you end up getting a ton of alerts for stuff that really doesn’t matter much – by customizing our alerts so they really only trigger when “the poo hits the fan,” we don’t fall into that trap.
If a team member wants to get a more general overview on the health of a server, they can log in to the Observium web interface.
Observium doesn’t do some things I would really like to see, for example, as-is the alert suppression/escalation (getting someone to “acknowledge” an alert has triggered before it triggers again) features are a little light, and I would like to see the ability to turn system events (aka, a server rebooted) into alerts. I would also like to see some of the automatic discovery capabilities for Linux hosts improved or built-in to the system, but in order to overcome this, I wrote a script in bash that automatically makes all of the snmp/firewall/ssh key/configuration changes required on a target server and successfully discovers the device in Observium. If you’d like a copy of the script, please let me know in a comment and I’d be happy to share. Other than these minor quibbles, I’m very happy with the solution the Observium team has put together, and you cannot beat the functionality for the price.
Observium comes in two “flavors,” the “Community Edition” and the “Pro Edition,” and the “Pro” edition only costs £150 (about $225) per year, way, way cheaper than some of the other monitoring solutions available. If it’s something you’re interested in, you only get the alerting functionalities and capabilities from the Pro version, so I highly recommend going down that route.
This platform is and will be a work-in-progress with more features to come, including application monitoring, more advanced alerts, and hopefully some reclaim-specific customizations. We’ll keep tuning this Reclaim engine so you can go create amazing stuff!


